Switch
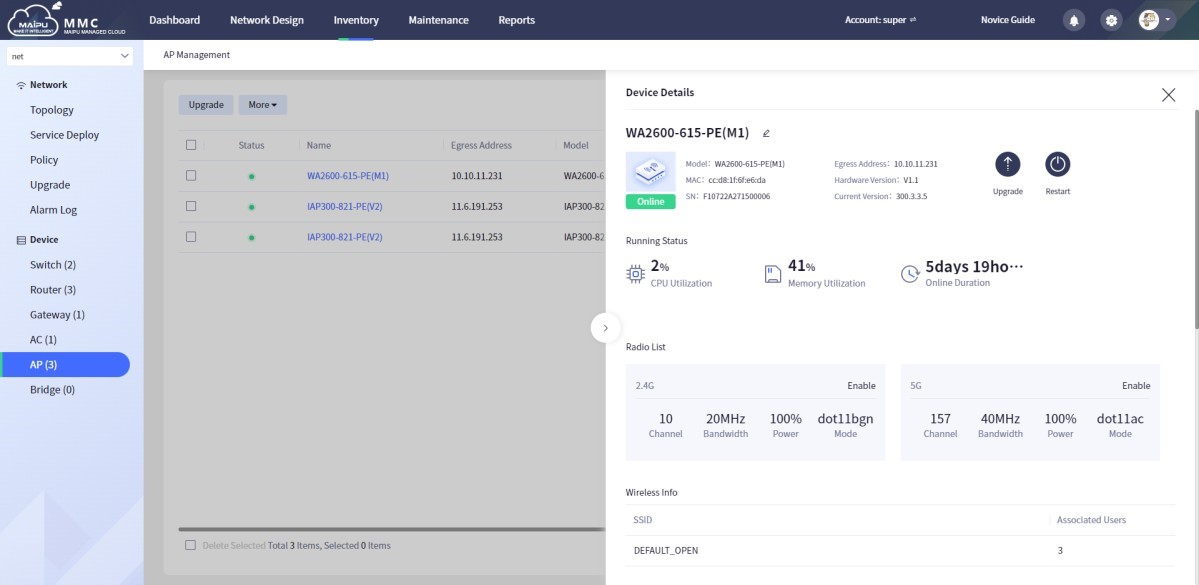
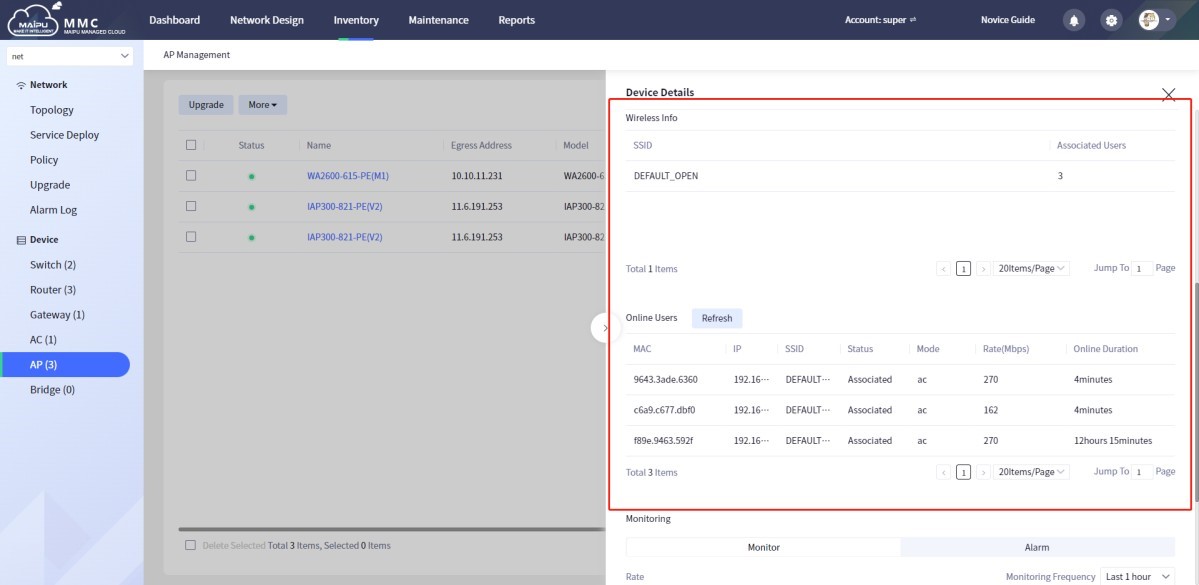
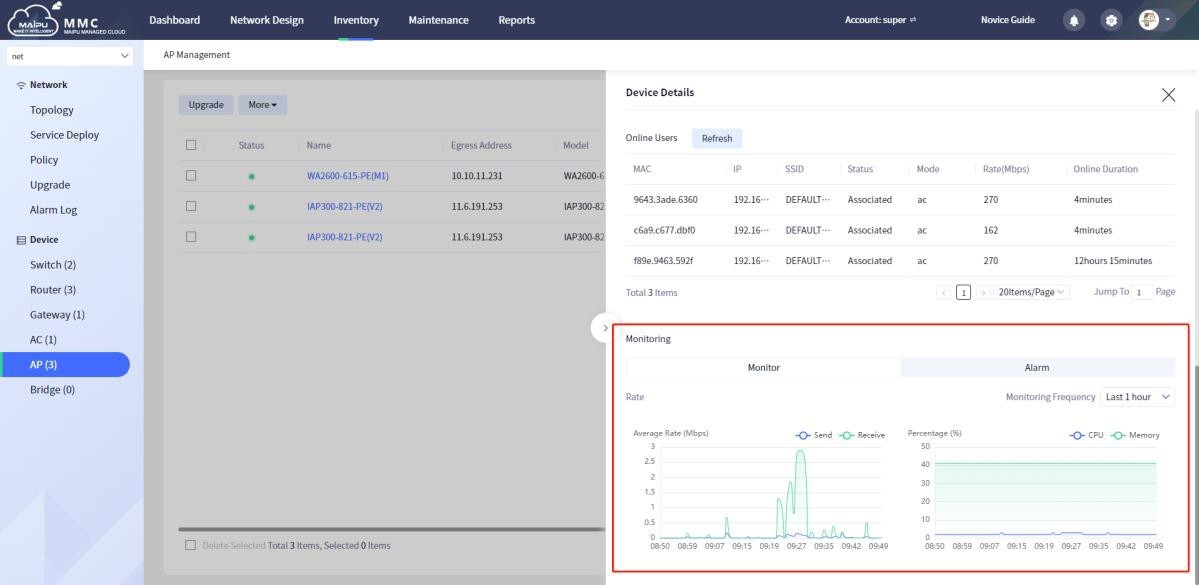
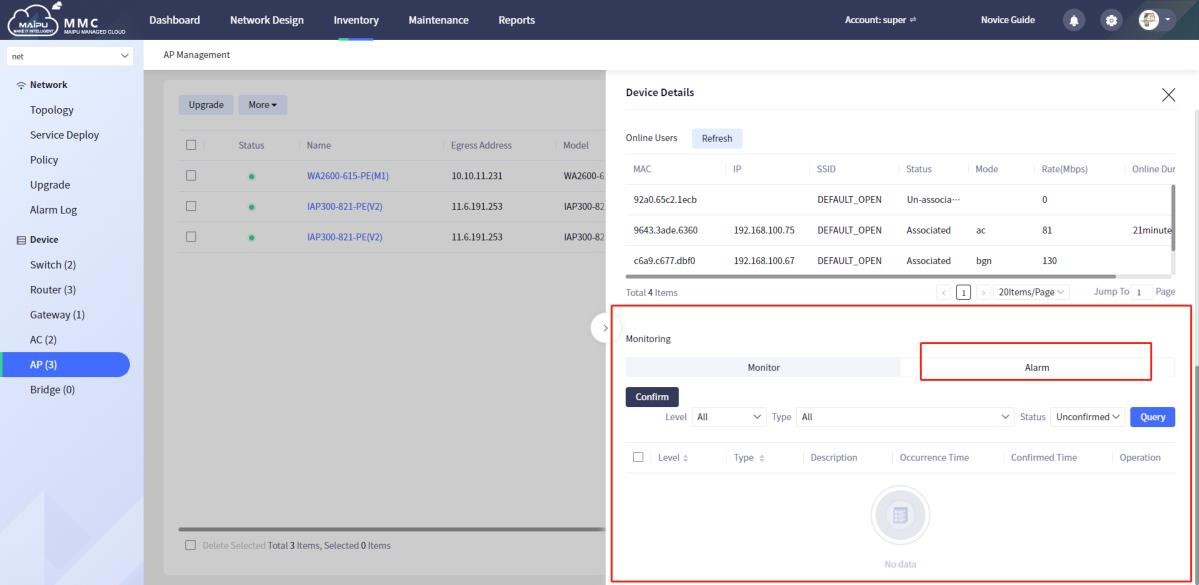
- Wifi - Access Point
- Firewall
- Router
- Module Quang
![Module Quang Cisco]() Module Quang Cisco
Module Quang Cisco![Module quang HPE]() Module quang HPE
Module quang HPE![Module quang Maipu]() Module quang Maipu
Module quang Maipu![Module quang Brocade]() Module quang Brocade
Module quang Brocade![Module Quang Mellanox]() Module Quang Mellanox
Module Quang Mellanox![Module quang Fortinet]() Module quang Fortinet
Module quang Fortinet![Module quang Innolight]() Module quang Innolight
Module quang Innolight![Module quang Aruba]() Module quang Aruba
Module quang Aruba![Module quang OEM]() Module quang OEM
Module quang OEM![Module quang Juniper]() Module quang Juniper
Module quang Juniper![Module quang Dell]() Module quang Dell
Module quang Dell![Module quang Palo Alto]() Module quang Palo Alto
Module quang Palo Alto![Module quang Huawei]() Module quang Huawei
Module quang Huawei![Module quang Arista]() Module quang Arista
Module quang Arista![Module quang F5]() Module quang F5
Module quang F5![Module quang H3C]() Module quang H3C
Module quang H3C![Module Quang Allied Telesis]() Module Quang Allied Telesis
Module Quang Allied Telesis![Module quang SonicWall]() Module quang SonicWall
Module quang SonicWall![Module quang Mikrotik]() Module quang Mikrotik
Module quang Mikrotik![Module quang Handar]() Module quang Handar
Module quang Handar![Module quang Inphi]() Module quang Inphi
Module quang Inphi![Module Quang Intel]() Module Quang Intel
Module Quang Intel![Module quang Finisar]() Module quang Finisar
Module quang Finisar![Module quang Ascent]() module-quang-ascent
module-quang-ascent![Module Quang UniFi]() Module Quang UniFi
Module Quang UniFi![Module Quang Avago]() Module Quang Avago
Module Quang Avago
- Máy chủ (Server)
Hãng sản xuất
Chassis
Cấu hình
Máy trạm Workstation
- Thiết bị lưu trữ (SAN, NAS)
- Load Balancing
- Video Conferencing
- Phụ kiện máy chủ
- Thiết Bị IoT
- Phụ Kiện Mạng